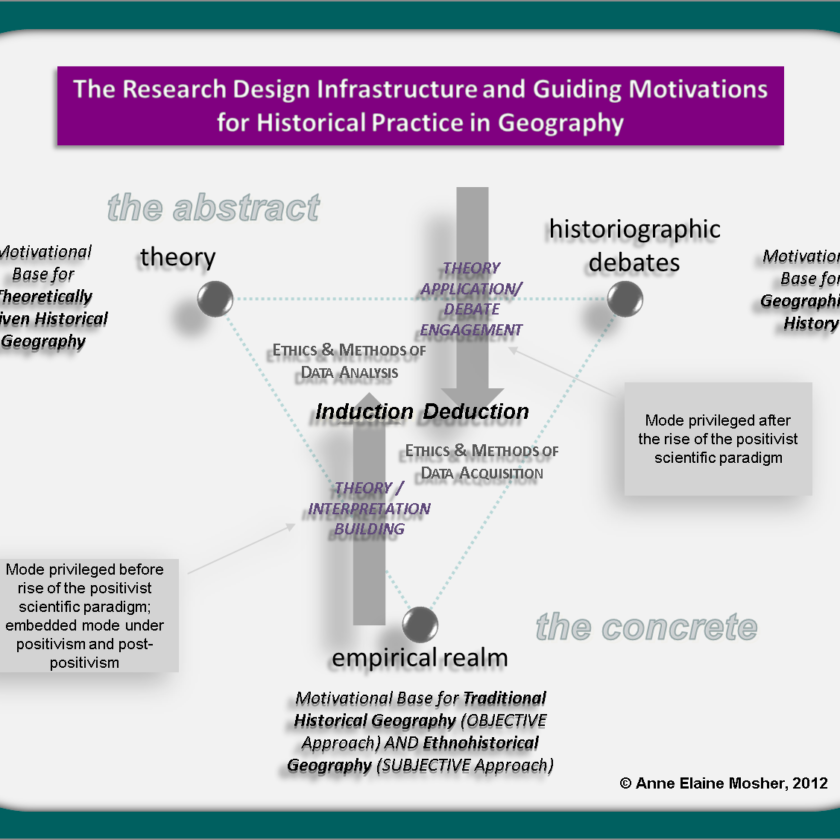
The diagram shown above is a little something that I've been cooking up over the past decade or so. It has emerged as a guiding research framework out of seminar and class discussions with graduate students, advanced undergrads and some colleagues. To see a guided explanation of how the diagram works, check out this Prezi. Please have a look and then tell me what you think. I've been trying to figure out how to develop this into a peer-reviewed publication for a very long time.
(If the Prezi does not load in the frame, you can always access it HERE.

You must be logged in to post a comment.